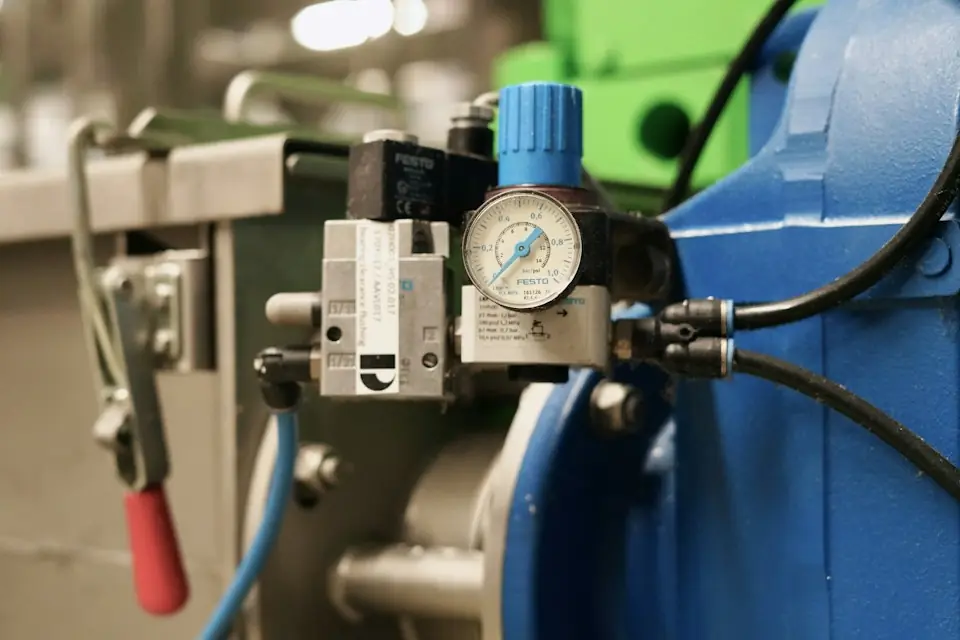
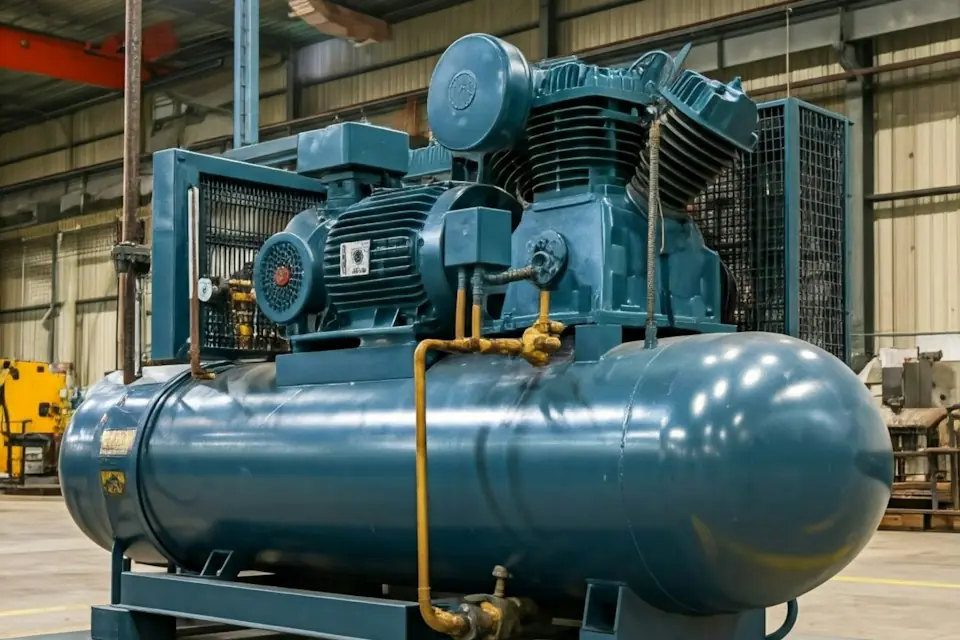
- Evaluate pneumatic-equipment energy efficiency using both m³(ANR) per 1,000 cycles and allocated kWh per 1,000 cycles; compressor power alone is insufficient.
- Select the lowest tested pressure setting that meets load, response and cycle-time requirements. Raising pressure beyond this setting increases leakage and air use without demonstrating better performance.
- Measure leakage by operating state, 0.02 MPa pressure bin and steady valve-position combination, then convert all air volumes to the same reference atmosphere.
- Assess annual cost, payback and five-year total cost of ownership only after safety functions, cycle time and quality meet the specified criteria.
00Executive Summary
Pneumatic industrial manipulators use compressed air for load balancing, lifting, clamping, turning, brake release and vacuum generation. Air consumption per device, leakage during production stops, pressure losses by section and retrofit payback must each be calculated from measured data. Compressor nameplate power and inlet pressure cannot replace these results. ISO 11011:2013 divides the system into supply, transmission and demand subsystems and calls for assessment through data collection, analysis and a written report [1]. Accordingly, this method aligns electricity meters, total flow, branch flow, dynamic pressure and production counts on a common time base.
Free-air volume uses the ISO 8778:2003 standard reference atmosphere throughout: 20 ℃, 100 kPa absolute pressure and 65% relative humidity, expressed in m³(ANR) [8]. Meter data using other reference conditions must be converted before aggregation.
The concurrent average supply-side specific power SP_sys is used to allocate electricity consumption. Actual electricity savings and financial benefits use only a marginal power–flow model with matched load bins, or measured before-and-after values normalized for the entire compressor station. On the demand side, flow integration separates production air from leakage; on the transmission side, synchronized pressure waveforms are assessed sample by sample for the peak-flow action and the action with the lowest inlet pressure. ISO 1217:2009 defines the applicability of compressor flow and power acceptance data [4], while the ISO 6358 series covers steady-state flow characteristics and system flow-capacity calculations within its stated scope [5][6][7]. Neither replaces concurrent site measurements.
Key Conclusions
- Energy-consumption calculations shall use free-air volume at a common reference state. If gauge pressure, absolute pressure, actual-condition volume, and m³(ANR) are mixed, the report fails the data-quality gate.
- Classify by the conservative upper bound
R_leak,Uof annual branch leakage-volume share: ≤5% is Grade A; >5% and ≤10% is Grade B; both pass; >10% fails. The leakage percentages in U.S. Department of Energy information use compressor capacity or system air supply as the accounting boundary [9], which differs from this report's denominator of annual branch volume for one machine. The two percentages shall not be converted directly. This report fixes 10% as the project-release upper limit. - The pressure criterion passes only when the conservative upper bound of total pressure loss from compressor-package discharge to the critical-actuator inlet is no greater than 10% and the conservative lower bound of minimum dynamic inlet pressure meets the design minimum. Failure of either condition means the pressure criterion fails [9].
- For one machine, use m³(ANR) per 1,000 cycles and allocated kWh per 1,000 cycles as energy-efficiency metrics, and separately report production air use, leakage air use, and idle pressure-retention air use. Allocated electricity consumption is not evidence of actual electricity savings.
- Overall release uses a one-out-of-six rejection rule covering data, leakage, pressure, energy efficiency, economics, and functional safety. Leakage, pressure, energy-efficiency, and economic criteria are evaluated at expanded-uncertainty bounds in the unfavorable direction. The project passes only when all six criteria pass.
01Scope, System Boundaries, and Terminology
The assessment covers the manipulator, end tooling, vacuum generators, local air storage, filter-regulator assemblies, hoses and equipment branch. The measurement boundary is divided into supply, transmission and demand. Supply includes electricity for compressors, cooling, drying, filtration and auxiliaries. Transmission includes mains, ring networks, branches and terminal connections. Demand extends from the equipment-branch isolation valve to actuators, vacuum generators and process blow-off outlets. ISO 4414:2010 and GB/T 7932-2017 specify general rules and safety requirements for pneumatic systems and components in machinery [2][3]. No efficiency retrofit may weaken pressure-loss protection, residual-energy discharge, isolation, pressure limiting, grip retention or prevention of unintended release.
| Symbol | Definition | Units and Rules |
|---|---|---|
| V_ANR | Free-air volume at the ISO 8778 standard reference atmosphere | m³(ANR) |
| q_ANR | Instantaneous volumetric flow at the standard reference atmosphere | m³/min(ANR) |
| E_sys | Electrical input to the supply subsystem during the same measurement period, including auxiliaries within the assessment scope | kWh |
| SP_sys | System-average specific power, E_sys/V_supply; used only for allocation metrics | kWh/m³(ANR) |
| SP_marg,b | Whole-station marginal specific power in load bin b | kWh/m³(ANR) |
| V_prod | Free-air volume required for conforming production cycles | m³(ANR) |
| V_leak | Free-air volume lost through non-functional leakage | m³(ANR) |
| V_total | Total equipment-branch volume across all pressurized states; synonymous with V_device | m³(ANR) |
| I_prod | Production air-use intensity, 1000 V_prod / N_cycle | m³(ANR) per 1,000 cycles |
| I_leak | Leakage air-use intensity, 1000 V_leak / N_cycle | m³(ANR) per 1,000 cycles |
| I_air | Total air-use intensity, 1000 V_total / N_cycle | m³(ANR) per 1,000 cycles |
| I_e,alloc | Allocated electricity intensity, 1000 E_device,alloc/N_cycle | kWh per 1,000 cycles |
| R_leak | Leakage volume as a share of total air supplied to the equipment branch | % |
| R_leak,U | Leakage-share upper bound including expanded uncertainty in the unfavorable direction | % |
| R_Δp,total,U | Total pressure-loss upper bound from P0 to P3, including expanded uncertainty in the unfavorable direction | % |
A “cycle” is defined from workpiece pickup authorization through completed release and return to the starting state for the next pickup. Count rework, no-load, and commissioning cycles separately; do not include them in conforming production cycles. Whenever the equipment branch remains pressurized during production, changeover, breaks, or off-shift periods, include all of that time in pressurized hours.
Operating states are mutually exclusive, with each sample assigned one code only: P accepted production, R rework, S commissioning or empty cycling, C changeover, I idle and pressurized, F faulted and pressurized, and D depressurized. If controller state codes are unavailable, reconstruct the state using all four sources: cycle-permission signals, equipment alarms, branch-isolation-valve feedback and shift records. If any source is missing, the state-resolved report fails the data criterion.P is production air use; R/S/C/I/F are reported separately. Nonzero flow in state D is treated as a meter zero-offset or isolation-valve internal-leakage anomaly. This classification distinguishes production air, unproductive consumption and air used for safe pressure retention. Off-shift leakage must not be included in individual-action efficiency.
02Measurement Architecture and Data-Quality Criteria
Place meters along the energy flow: the main electricity meter records supply-system energy input, the total flow meter records m³(ANR) entering the distribution system, the equipment-branch meter records total manipulator air use, and the controller records cycles, models, states and alarms. The four synchronized pressure channels are fixed as follows: P0 downstream of the compressor discharge check valve and upstream of the first air-treatment component; P1 at the main inlet downstream of all air-treatment equipment; P2 at the main end and upstream of the equipment-branch isolation valve; and P3 at the inlet of the critical actuator. If several components have critical pressure requirements, relocate P3 and test each independently; every location must pass. Total electricity use and total free-air flow for parallel compressors must be summed over the same time window.
| Data Item | Minimum Acquisition Requirements | Data Acceptance Criteria |
|---|---|---|
| Supply Electricity and Total Flow | 7 consecutive production days covering all shifts and released product models, sampled at intervals no greater than 1 s | Valid-data coverage at least 95% |
| Branch Flow | Covers production, changeover, breaks, and off-shift pressurized periods | Complete instrument reference-state and flow-direction records |
| Dynamic Pressure | 30 consecutive runs each of the peak-flow and lowest-inlet-pressure actions; four pressure channels sampled at no less than 1 kHz | Common DAQ and clock; channel skew no greater than 1 sample; combined sensor/conditioner/DAQ -3 dB bandwidth at least 200 Hz; all 30 waveforms complete. If both selections identify the same action, test one set. |
| Leakage Flow | Record each operating-state, pressure-bin, and steady valve-position combination for 30 minutes without production, motion, or intentional air use; sampling interval no greater than 1 s | Valid coverage at least 95% per combination; pressure within ±0.01 MPa of the bin center |
| Leakage Pressure-Decay Review | After all Section 05.2 prerequisites are met, record pressure and absolute air temperature | Difference between the two results no greater than 10%; do not use the method if any prerequisite fails |
| Cycle and Product Counts | Controller or independent counter with timestamps synchronized to flow | Count difference no greater than 1% |
| Instrument Status | Record instrument ID, range, accuracy, and calibration validity | Expired calibration fails the data criterion |
This method limits relative expanded uncertainty to 5% for branch flow, 2% for electrical energy, and 2% for pressure. The budget must include calibration, repeatability, reference-state conversion, timing, state classification, and annual extrapolation; instrument nameplate accuracy alone is insufficient. If a limit is exceeded, the energy-efficiency comparison cannot proceed to economic evaluation. Use the same product-mix weights, conforming-cycle definition, and annual pressurized hours before and after the retrofit. If the product mix changes, normalize both periods using the frozen weights rather than comparing their unadjusted totals.
Before evaluation, freeze product weights w_j using the company's formally approved annual production plan. If no annual plan exists, use the shares of conforming cycles for each model during 7 consecutive baseline days. Every weighted model shall complete at least 30 conforming cycles both during the baseline and after the retrofit; otherwise, the data criterion fails. Calculate normalized air-use intensity using the following equation, with the same w_j before and after and Σw_j=1:
I_air,norm = Σ[j=1..m] w_j · I_air,jClock error between branch flow and cycle state shall be ≤100 ms, and clock error between electrical energy and total supply flow shall be ≤1 s. The four pressure channels use the same DAQ with an upper limit of 1 sample of channel skew. Do not interpolate missing samples. The data criterion fails immediately if the total missing rate exceeds 5%, a missing segment covers a peak action, or any sample is missing during a leakage test. Report instrument expanded uncertainty with coverage factor k=2. Standard uncertainties of annual air use in the two periods are u_base=U_base/2 and u_after=U_after/2; with correlation coefficient ρ:
U_ΔV = 2·sqrt[u_base^2 + u_after^2 - 2ρ·u_base·u_after]


ΔV_L = (V_base - V_after) - U_ΔV
U_base and U_after are absolute expanded uncertainties of annual air use in the two periods. Use the recorded ρ only when written evidence establishes independence of the calibration chain, instruments, sampling, and conversion errors. If any evidence is missing, use the fixed conservative upper bound U_ΔV=U_base+U_after. Air savings are established only when ΔV_L>0; equality to zero also fails. All derived hard gates use the following unfavorable-direction bounds:
η_air,L = [1 - (I_air,after + U_I,after)/(I_air,base - U_I,base)]·100%


V_leak,U = Σ(s,b,k) (q_leak,s,b,k + U_q,s,b,k)·60·(H_s,b,k + U_H,s,b,k)


R_leak,U = V_leak,U/(V_device,year - U_V,device)·100%
A nonpositive denominator fails the data criterion. Energy efficiency requires both η_air,L≥5% and ΔV_L>0; leakage requires R_leak,U≤10%. The pressure and economic uncertainty-bound equations appear in Chapters 06 and 08 respectively.
03Compressed-Air Baseline and Energy-Efficiency Metrics
Use the contemporaneous measured system-average specific power only to calculate the allocated energy-consumption metric:
SP_sys = E_sys / V_supply


E_device,alloc = SP_sys · V_total


I_air = 1000 · V_total / N_cycle


I_e,alloc = 1000 · E_device,alloc / N_cycle
E_sys must include electricity consumed by the main motors, cooling fans, dryers, drains and control auxiliaries within the assessment boundary. V_supply is the m³(ANR) delivered to the network during the same period. Nameplate power alone omits part-load, unloaded-operation and auxiliary losses. ISO 1217:2009 flow and power acceptance data for displacement compressors may be used to check the rated operating point, but cannot replace site-specific annual specific power [4]. The resulting E_device,alloc and I_e,alloc are for cost allocation only and do not represent actual compressor-station electricity savings.
Actual electricity savings use a marginal power-versus-flow model within the same load bin. Put 1 min synchronized averages of total station flow and total active power into load bin b. Every bin used shall contain at least 30 complete samples both at baseline and after the retrofit; its sampled flow range shall cover the pre- and post-retrofit flows in that bin; and compressor start/stop sequence, control mode, supply-pressure setting, and air-treatment operating combination shall be the same. In each bin, fit measured active power versus free-air flow by least squares as P_b=α_b+m_bq_b and define SP_marg,b=m_b/60. Because m_b is in kW/[m³/min(ANR)], SP_marg,b is in kWh/m³(ANR). Expanded uncertainty U_SP,b includes contributions from regression slope, electricity meter, and total flow meter:
ΔE_actual = Σ(b) ΔV_b · SP_marg,b


ΔV_b,L = max(ΔV_b - U_ΔV,b, 0)


SP_marg,b,L = max(SP_marg,b - U_SP,b, 0)


ΔE_actual,L = Σ(b) ΔV_b,L · SP_marg,b,L
The binned model is invalid if a load bin has insufficient samples, post-retrofit flow lies outside the measured range, the compressor sequence or control mode changes, m_b≤0, or U_SP,b/SP_marg,b>10%. As an alternative, normalize whole-station measurements by operating-condition stratum g, defined by product mix, compressor sequence, control mode, compressor-inlet temperature in 5 ℃ bands, and supply-pressure setting in 0.02 MPa bands. Each stratum requires at least 30 complete 1 min active-power samples before and after the retrofit and the same approved annual hours H_g:
E_sys,norm,x = Σ(g) mean[P_x,g]·H_g,  x∈{base,after}


ΔE_full,L = E_sys,norm,base - E_sys,norm,after - U_ΔE,full
Use ΔE_full,L in place of ΔE_actual,L for economic calculations. If neither the binned marginal model nor normalized whole-station measurements satisfy this section’s data requirements, the economic criterion fails.
Report production air intensity I_prod, leakage air intensity I_leak, total air intensity I_air and allocated electricity intensity I_e,alloc together. A reduction in total air use accompanied only by fewer cycles does not demonstrate improved efficiency. Compare total air intensity before and after the retrofit, using the reduction rate defined below:
η_air = (I_air,base - I_air,after) / I_air,base · 100%The energy-efficiency criterion requires the point estimate η_air≥5%, conservative lower bound η_air,L≥5%, and, using coverage factor k=2, an air-saving lower bound ΔV_L>0. Failure of any condition means the criterion fails. Report the raw difference, expanded uncertainty and conservative lower bound as well as the percentage.
04Effective Air Consumption of the Pneumatic Industrial Manipulator
Direct integration by the equipment-branch flow meter produces the official measured result:
V_total = V_device = ∫[H_pressurized] q_ANR(t) dt


V_leak = Σ(s,b,k) q_leak,s,b,k · 60 · H_s,b,k


V_prod = ∫[P] max[q_ANR(t)-q_leak,P,b(t),k(t), 0] dt


V_s = ∫[s] max[q_ANR(t)-q_leak,s,b(t),k(t), 0] dt,  s∈{R,S,C,I,F}


V_total = V_prod + V_R + V_S + V_C + V_I + V_F + V_leak
The integration variable dt is in min. b(t) is the equipment-inlet pressure bin at time t, with a fixed bin width of 0.02 MPa; k(t) is the steady-state valve-position combination mapped from PLC outputs. q_leak,s,b,k is the leakage baseline measured in Section 05.1 for the same state, pressure bin, and valve-position combination. Every observed s-b-k combination requires a baseline; if any is missing, the component report fails. V_total is the branch-flow-meter total integral. V_prod and V_R/V_S/V_C/V_I/V_F are functional components after subtracting the concurrent leakage baseline. Within the 7-day evaluation window, total closure error |V_total-(V_prod+V_R+V_S+V_C+V_I+V_F+V_leak)|/V_total shall be ≤2%; if it exceeds 2%, the component report fails. If q_ANR<q_leak,s,b,k at any sample, do not truncate the result to force closure. First retest the leakage baseline for that combination; if the condition remains, the data criterion fails. Rework R and commissioning or no-load cycles S enter the total but not conforming production air use.
The theoretical free-air quantity for a double-acting cylinder is used only to check the order of magnitude of measured flow. Let A_b be bore area, A_r piston-rod area, and L stroke. With absolute supply pressures p_1,abs and p_2,abs for extension and retraction, respectively, and supply temperatures T_1 and T_2, the theoretical quantity for one complete reciprocating cycle is:
V_ANR,theory = A_b·L·(p_1,abs/p_ANR)·(T_ANR/T_1)


             + (A_b-A_r)·L·(p_2,abs/p_ANR)·(T_ANR/T_2)
Here, p_abs = p_gauge + p_atm. When checking theoretical volumes, separately include dead volumes, hose filling and venting, cushioning, valve-manifold pilots, brakes, tooling and vacuum generators. Pneumatic balancing circuits do not necessarily fill and exhaust their full volume each cycle, so formal calculations must use integrated flow. Integrate vacuum-generator consumption over actual on-time. Continuous blow-off, exhaust left open in error and vacuum holding during idle time all belong in V_I and must not be counted as productive work.
Group mixed-model equipment data by operating state and product model. Each cycle’s integration window begins at the pickup-permission rising edge and ends at the rising edge confirming the starting state for the next cycle. Assign pressurized time without a cycle-confirmation signal to I rather than adjacent cycles. Use the mean flow in state D over 60 consecutive seconds as the daily zero check. If its absolute value exceeds 0.5% of meter full scale, that day’s branch-flow data fail. Retain the original 1 s sequence, per-cycle results, and daily totals; cumulative-volume differences between these levels must not exceed 0.5%.
ISO 6358-1:2013 with its 2020 and 2026 amendments, and ISO 6358-2:2019 with its 2026 amendment, are used to test the flow characteristics of fixed- or variable-flow-path components within their stated scopes [5][6]. ISO 6358-3:2014 uses known component and piping characteristics to calculate steady-state system flow capacity [7]. Do not apply equations outside the applicable part's scope to cylinders, air receivers, check devices with cracking pressure, quick-exhaust valves, or internally piloted regulators. For a regulator, use the manufacturer's pressure–flow curve covering the project set pressure and actual upstream-pressure, downstream-pressure, and flow ranges. If that curve is unavailable, use synchronized measurements of upstream pressure, downstream pressure, and flow; do not substitute an ISO 6358 calculation.
05Leakage Measurement, Conversion, and Classification
05.1 Branch Mass-Flow-Meter Method
The primary method for the equipment-leakage release value uses a branch mass flow meter. For every state s, 0.02 MPa pressure bin b, and steady-state valve-position combination k occurring in Chapter 04, reproduce that combination in test mode; remove the workpiece and suspended load; mechanically lock motion; turn off blow-off, the vacuum generator, and actuator commands; and record continuously for 30 min. Safety functions that require continuous air for risk control shall be metered on an independent branch and classified as functional air use, not leakage. If safety-function air use cannot be separated from leakage, the data for that s-b-k combination fail.
Sample each combination at intervals no greater than 1 s, maintain inlet pressure within ±0.01 MPa of the bin center, and achieve at least 95% valid-data coverage. Any actuator or intentional air-use command invalidates the test. Take q_leak,s,b,k as the mean of valid samples for that combination. Include flow-meter calibration, repeatability, reference-state conversion, zero offset, and pressure stability in expanded uncertainty U_q,s,b,k. Measure baseline and post-retrofit leakage separately; do not reuse one period’s value in the other.
When the mass flow meter directly reports the ISO 8778 reference state, record its configuration of 20 °C, 100 kPa absolute, and 65% relative humidity. When the instrument reports actual-condition volumetric flow q_op, convert it using the compressibility factor Z from the calibration certificate:
q_ANR = q_op · (p_op,abs/p_ANR) · (T_ANR/T_op) · (Z_ANR/Z_op)Acquire p_op,abs and T_op with the same timestamp as flow. If the record lacks absolute pressure, absolute temperature, compressibility factor, or humidity configuration, the data for that bin fail. Valve cross-port leakage, nonzero-air-consumption drains, and air used by instrument impulse lines are included within the leakage boundary.
05.2 Shutdown Pressure-Decay Cross-Check
Use the pressure-decay method only when all of the following conditions are met: the workpiece and suspended load have been removed; mechanical parts are locked; compressed air is locked out and tagged out; the safety holding circuit is physically isolated from the test section; the controlled P&ID, pipe-segment list, air-receiver list, and component BOM provide 100% item-by-item coverage of the isolated volume; and the test permit is signed by the equipment and safety owners. Do not start a pressure-decay test if any condition is missing.
After the system reaches the operating gauge pressure p_1,g recorded in the controlled recipe, isolate the air supply. Fix the endpoint at p_2,g=0.50p_1,g and linearly interpolate the crossing time t from the pressure time series. The DOE factor 1.25 applies only to this half-pressure endpoint and corrects average leakage during decay to the initial system pressure [9][11]. Calculate using absolute endpoint temperatures:
q_avg,ANR = V_sys · (Z_ANR·T_ANR/p_ANR) · [p_1,abs/(Z_1·T_1) - p_2,abs/(Z_2·T_2)] / t


q_leak,P1,ANR = 1.25 · q_avg,ANR
Use m³ for V_sys; use the same pressure unit for p_1,abs, p_2,abs, and p_ANR=100 kPa(abs); use K for T_1, T_2, and T_ANR=293.15 K; take Z_1, Z_2, and Z_ANR from calibration certificates or controlled property tables; and use min for t. The result is invalid if |T_2-T_1|>2 K, any compressibility factor is missing, any volume item lacks controlled dimensions, the minimum terminal pressure reaches the safety-circuit design lower limit, or the pressure curve does not cross the exact half-pressure point. Calculate the relative difference between the two tests as |q_1-q_2|/[(q_1+q_2)/2] and use the arithmetic mean only when it is no greater than 10%.
If the pressure-decay result differs by more than 10% from the mass-flow-meter result at the same initial pressure bin, the leakage data fail. This cross-check neither replaces the state–pressure-bin–valve-position measurements in Section 05.1 nor directly supplies annual leakage volume.
05.3 Compressor Load/Unload Screening Method
Publish mean loaded time T_on and unloaded time T_off only when one fixed-speed compressor supplies the system independently under load/unload control, all non-leakage air use is isolated, loaded output equals the controlled full-load flow, and unloaded output is zero. For 10 cycles, loaded and unloaded switching pressures must each remain within ±1% of their respective 10-cycle means. Calculate leakage as a share of compressor capacity using the DOE method [9]:
R_leak,capacity = T_on / (T_on + T_off) · 100%Do not publish the corresponding ratio if any prerequisite of the load/unload method is unmet. That method screens total supply-system leakage; individual devices are measured under Section 05.1. The two methods use different system boundaries and denominators, so their percentages must not be averaged directly.
05.4 Equipment-Branch Leakage Share
V_leak,year = Σ(s,b,k) q_leak,s,b,k · 60 · H_s,b,k


R_leak = V_leak,year / V_device,year · 100%


R_leak,U = V_leak,U / (V_device,year - U_V,device) · 100%
V_device,year is the annual air supplied to the same branch in all pressurized states, including production, rework, commissioning, changeover, idle, fault, and leakage states. Do not add leakage again to V_device,year when that total has already been integrated by the branch flow meter. Add V_leak,year to the functional components only when estimating the annual total from the component model. Release uses R_leak,U as defined in Chapter 02; the point estimate is for display only.
| Grade | R_leak,U | Pass Criterion | Required Action |
|---|---|---|---|
| A | ≤5% | Pass, low leakage | Maintain quarterly retesting |
| B | >5% and ≤10% | Pass, controlled leakage | List and repair leaks within 30 days. An open work order at the end of the 30th day changes the result to fail. |
| C | >10% and ≤20% | Fail | After repair, repeat measurements for every Section 05.1 combination |
| D | >20% | Fail — excessive leakage | Unload and remove suspended loads, mechanically secure moving parts, and apply lockout/tagout before isolating and repairing non-production air supplies |
The U.S. Department of Energy's third-edition Sourcebook describes leakage below 5%–10% in well-maintained systems and 20%–30% in poorly maintained systems [9]. Its load/unload method relates to compressor capacity or whole-system supply. Here, the denominator of R_leak is the annual total air volume supplied to a single equipment branch, so it cannot be directly converted to the DOE ratio. R_leak,U≤10% is a project limit defined independently for this assessment method, not a universal equipment specification. Leakage in a safety-related pressure-retention circuit must first be addressed under the equipment safety criteria. After repair, repeat all six assessments in Chapter 11.
06Pressure Loss, Flow Capacity, and Minimum Pressure
For pressure evaluation, select the peak-flow action and the action with the lowest inlet pressure. First record synchronized flow and pressure for 10 runs of every pneumatic action for every released product model. Select as the peak-flow action the action with the highest dynamic-flow maximum, and as the lowest-inlet-pressure action the action with the lowest P3 minimum; if they are the same action, retain only one. During formal evaluation, record 30 consecutive runs of each selected action. Dynamic flow and all four pressure channels shall use the same 1 kHz sampling clock and have a combined −3 dB bandwidth of at least 200 Hz.
Calculate pressure loss at every sample of every formal test waveform, applying expanded uncertainty in the unfavorable direction. p_0, p_1, p_2, and p_3 are synchronized gauge pressures; U_0, U_1, U_2, and U_3 are their corresponding absolute expanded uncertainties:
R_Δp,main,U = max(i,t){1 - [p_2,i(t)-U_2,i(t)]/[p_1,i(t)+U_1,i(t)]}·100%


R_Δp,total,U = max(i,t){1 - [p_3,i(t)-U_3,i(t)]/[p_0,i(t)+U_0,i(t)]}·100%


p_3,min,L = min(i,t)[p_3,i(t)-U_3,i(t)]
i spans the 30 waveforms of all selected actions and t spans every sample; if any denominator is not positive, the data criterion fails. The DOE Sourcebook states that pressure loss from compressor discharge to the final point of use should be well below 10% of discharge pressure, with a maximum design header pressure drop of 1%–2% [9]. This report uses R_Δp,total,U≤10% as the project limit and R_Δp,main,U≤2% as the limit for a new or reconstructed header. These are the release gates for total and header pressure drop, respectively; Chapter 11 defines the acceptance basis. The equipment shall also satisfy p_3,min,L≥p_required,min,g. Take p_required,min,g only from the minimum operating gauge pressure in a controlled design document; without that document, the pressure criterion fails.
| Inspection Item | Pass Criterion | Fail Trigger |
|---|---|---|
| New or Reconstructed Header Pressure Drop | R_Δp,main,U≤2% | Conservative upper bound >2% |
| Total Pressure Drop | R_Δp,total,U≤10% | Conservative upper bound >10% |
| Minimum Dynamic Inlet Pressure | p_3,min,L≥p_required,min,g | Conservative lower bound below the design minimum |
| Repeatability | Include all 30 waveforms for every selected action in the conservative-bound calculation | Missing waveform or any uncertainty-bound criterion fails |
For insufficient end-point flow, identify the restriction first; increasing compressor discharge pressure is not a substitute for corrective work. Check filters, push-in fittings, hoses, valve manifolds and silencers against the measured dynamic peak flow. Use ISO 6358 data for components within its scope and ISO 6358-3 calculations for component assemblies. For regulators, use the manufacturer's pressure–flow curves or synchronized measurements specified in Chapter 04. After modification, all 30 waveforms for each selected action must enter the guarded-limit calculation. The pressure assessment passes only when all pressure and functional criteria are met.
Pressure-drop segmentation uses synchronized samples from the three fixed segments P0-P1, P1-P2, and P2-P3. If any segment accounts for more than 40% of the simultaneous total P0-P3 pressure drop, make that segment the first corrective-action priority; do not calculate the ratio when total pressure drop is not positive. This ratio determines corrective priority only and does not change the 2% header or 10% total pressure-drop limits. The upper limit of each pressure-sensor range shall not exceed 2 times the controlled design operating gauge pressure, and the zero differences among the four channels in the depressurized state shall be less than 0.5% of full scale; otherwise, the pressure data fail.
07Electricity Allocation and Annual Cost
Calculate the annual allocated electricity consumption and allocated electricity cost for a single machine using the contemporaneous system-average specific power [10]:
E_device,alloc,year = SP_sys · V_device,year


C_energy,alloc,year = E_device,alloc,year · c_e


C_leak,alloc,year = SP_sys · V_leak,year · c_e
c_e is the all-in unit electricity price from the company's bill, in yuan/kWh. Label all three results above as “allocated”; they must not be counted as actual electricity savings or realizable financial benefits. Actual annual electricity and electricity-cost savings use the load-bin results from Chapter 03:
ΔE_actual,year = Σ(b) ΔV_b · SP_marg,b


ΔC_energy,year = Σ(b) ΔV_b · SP_marg,b · c_e,b


ΔC_energy,L,year = Σ(b) ΔV_b,L · SP_marg,b,L · c_e,b,L
When time-of-use pricing applies, also divide load bins by tariff period; take c_e,b,L as the lower bound of the corresponding billed electricity unit price. Include demand charges only when the retrofit reduces maximum demand within the billing window and the bill provides a definite amount; without that evidence, use zero. Use only documented amounts from the finance or maintenance system for maintenance, spare parts, and line-stoppage losses. Use zero for undocumented items; industry averages are prohibited.
Calculate supply-system average specific power on a rolling monthly basis. Use the common volume-weighted value SP_sys,common=(E_sys,base+E_sys,after)/(V_supply,base+V_supply,after) for allocation; do not introduce undocumented weighting rules. Actual savings always use SP_marg,b for the same load bin or the measured normalized whole-station difference, never SP_sys,common.
Extrapolate annual volume separately for production and pressurized states; do not multiply a single shift by 365. Production uses each model's normalized intensity and approved annual cycle count. Leakage uses the leakage flow for each state–pressure–valve-position combination and its annual pressurized hours. Changeover, idle and faulted states use the functional mean flow for each combination measured over 7 consecutive days and the annual combination hours from the production scheduling system. The annual model is:
V_device,year = Σ(j) I_prod,j·N_j/1000


              + Σ(s,b,k) q_leak,s,b,k·60·H_s,b,k


              + Σ(s=R,S,C,I,F; b,k) q_s,b,k·60·H_s,b,k
In the equation, q_s,b,k for each state is the functional average flow after deducting concurrent q_leak,s,b,k. Count the same volume only once. Within the 7-day evaluation window, first calculate the component model from measured N_j and H_s,b,k and compare it with the branch meter's raw integrated total for that window; if the difference exceeds 2%, annual extrapolation is prohibited. Only after the 7-day balance closes may the frozen annual N_j and H_s,b,k be used for extrapolation. At 12 months after project release, verify the annual model against the branch meter's full-year integrated total. If the difference exceeds 5%, the economic conclusion expires on the verification date and all six Chapter 11 criteria shall be reevaluated within 5 working days.
08Life-Cycle Cost and Investment Criteria
This report uses a fixed evaluation period of 5 years. Use only the company-approved project discount rate r; without an approved value, the economic criterion fails. The Chapter 09 calculation input fixes the discount rate at 5%; calculate other cases using the company-approved value. Calculate point-estimate life-cycle cost and net present value as follows:
LCC_5 = C_invest + Σ[y=1..5] (C_energy,y + C_maint,y + C_parts,y + C_stop,y)/(1+r)^y


NPV_save = Σ[y=1..5] (C_base,y - C_after,y)/(1+r)^y - C_invest
The conservative-bound calculation uses investment upper bound C_invest,U and annual net-savings lower bound S_y,L=C_base,y-C_after,y-U_S,y as inputs:
NPV_save,L = Σ[y=1..5] S_y,L/(1+r)^y - C_invest,U


K_n = Σ[y=1..n] S_y,L


PB_U = (n-1) + (C_invest,U-K_(n-1))/S_n,L,  K_(n-1)<C_invest,U≤K_n
n is the first year in which cumulative undiscounted net savings reach the investment upper bound; assume savings accrue uniformly within each year. If no such n exists within 5 years, if S_y,L≤0 in any year, or if a denominator is nonpositive, define PB_U as infinity. For equal annual savings, PB_U=C_invest,U/S_1,L. Include residual value, tax benefits and financing costs only when documented in a contract or financial system. Economic release requires NPV_save,L>0 and PB_U≤3.0 years, using uncertainty bounds rather than point estimates. Failure of either condition fails the economic criterion. Pressure, functional or safety failure still prevents overall release even when the economic criterion passes.
Use the same annual cycle counts, electricity-price series, and discount rate for the baseline and retrofit cases. Without a company-approved price-growth rate, use 0% over the five-year period; without a contractual residual value, use 0%. Derive actual-saving lower bounds only from the binned marginal model in Chapters 03 and 07 or normalized whole-station measurements. Exclude allocated savings based on average specific power from S_y,L. Retain unrounded calculations; display money to 0.01 yuan, volume to 0.1 m³, and ratios to 0.01 percentage points. Make decisions from unrounded values so display rounding cannot change a threshold result.
09Worked Example for One Equipment Branch
The following assumed inputs demonstrate the complete calculation: 180,000 conforming cycles/year, 3,000 production h, and 4,000 pressurized branch h. The retrofit comprises leak repair, a shorter vacuum-supply command window, and reduced terminal flow resistance. Assume an investment upper bound of 4,000.00 yuan; electricity price and its lower bound of 0.80 yuan/kWh; a 5-year discount rate of 5%; and electricity-price growth, maintenance, spare-parts, stoppage and demand-charge differentials, and residual value of 0. System-average specific power of 0.115 kWh/m³(ANR) is used only for allocation. The conclusions apply to these assumed inputs; actual projects require simultaneous measurements and formal test records.
09.1 Data, Leakage, and Uncertainty
Assume the following data-quality inputs: seven-day coverage 98.6%; annual air-use relative expanded uncertainty of 4.0% in both periods, including flow, reference state, timing, state classification, and annual extrapolation; and absolute expanded uncertainties of 33,960×4%=1,358.4 m³ and 12,720×4%=508.8 m³ respectively. Section 09.3 gives the marginal power–flow model uncertainty. Assume relative expanded uncertainty of 1.2% for each pressure channel, valid instrument calibration, channel skew ≤1 ms, and combined bandwidth 250 Hz. This assumed dataset passes the Chapter 02 data criteria.
Use a 0.70 MPa pressure bin for the worked example. For every steady valve-position combination in P/R/S/C/I/F, assume a 30-minute measurement window under Section 05.1 with actuator and intentional air-use commands at 0. Set every combination’s flow to 0.080 m³/min(ANR) before and 0.002 m³/min(ANR) after the retrofit. Relative expanded uncertainty is 4.0% in both periods: U_q,base=0.0032 m³/min and U_q,after=0.00008 m³/min. Treat annual pressurized hours as an exact input, U_H=0:
V_leak,base = 0.080 × 60 × 4000 = 19,200 m³(ANR)


V_leak,after = 0.002 × 60 × 4000 = 480 m³(ANR)
Leakage quantity uses the branch-flow method. The input difference between the 7-day branch total integral and state-component model is 0%, meeting the 2% closure criterion. Rework, commissioning, changeover, idle functional air use, and fault-state functional air use are fixed at 0; total branch air use consists only of production air use and leakage air use.
09.2 Air Use, Leakage, and Energy-Efficiency Bounds
Production air-consumption intensity decreases from 82 to 68 m³(ANR) per 1,000 cycles, corresponding to annual production air use of 14,760 and 12,240 m³(ANR), respectively.
| Metric | Before Retrofit | After Retrofit | Assessment Result |
|---|---|---|---|
| Annual Production Air Use | 14,760 m³(ANR) | 12,240 m³(ANR) | Reduced by 2,520 |
| Annual Leakage Air Use | 19,200 m³(ANR) | 480 m³(ANR) | Reduced by 18,720 |
| Total Annual Air Use | 33,960 m³(ANR) | 12,720 m³(ANR) | Point estimate reduced by 62.54% |
| Leakage-Share Point Estimate | 56.54%, Grade D | 3.77%, Grade A | Point estimate for display |
| Leakage-Share Upper Bound | 61.25%, Grade D | 4.09%, Grade A | After retrofit: ≤5%, pass |
| Total Air-Use Intensity | 188.67 m³ per 1,000 cycles | 70.67 m³ per 1,000 cycles | Point estimate reduced by 62.54% |
| Allocated Electricity Metrics | 3,905.4 kWh | 1,462.8 kWh | Allocation only; not evidence of actual electricity savings |
Calculate the leakage-share upper bound in the unfavorable direction:
R_leak,U,base = (0.080+0.0032)×60 × 4000/(33,960-1,358.4) = 61.2485%


R_leak,U,after = (0.002+0.00008)×60 × 4000/(12,720-508.8) = 4.0881%
The point estimate of annual air savings is 21,240 m³(ANR). Without documented correlation evidence between the periods, use the conservative linear bound: U_ΔV=1,358.4+508.8=1,867.2 m³ and ΔV_L=21,240-1,867.2=19,372.8 m³. The intensity expanded uncertainties are 7.5467 and 2.8267 m³ per 1,000 cycles respectively:
η_air,L = [1-(70.6667+2.8267)/(188.6667-7.5467)]×100% = 59.4229%Because η_air,L≥5% and ΔV_L>0, energy efficiency passes. Post-retrofit R_leak,U=4.0881%≤5%, so leakage is Grade A and passes.
09.3 Actual Electricity Savings and Conservative Economic Bounds
The load-bin input matrix uses 60 complete 1 min samples both before and after the retrofit. Compressor start/stop sequence, control mode, 0.70 MPa supply setting, and air-treatment operating combination are held the same. Three load bins cover all pre- and post-retrofit flow. The sum of expanded uncertainties in the air savings across the bins is fixed at 1,867.2 m³, and the expanded uncertainty in marginal specific power for every bin is 0.005 kWh/m³(ANR):
| Compressor-Station Flow Load Bin | ΔV_b | U_ΔV,b | SP_marg,b | U_SP,b | Electricity-Saving Point Estimate | Electricity-Saving Lower Bound |
|---|---|---|---|---|---|---|
| [0,10] m³/min | 5,520 m³ | 500 m³ | 0.100 | 0.005 | 552.00 kWh | 476.90 kWh |
| (10,20] m³/min | 10,080 m³ | 880 m³ | 0.112 | 0.005 | 1,128.96 kWh | 984.40 kWh |
| (20,30] m³/min | 5,640 m³ | 487.2 m³ | 0.124 | 0.005 | 699.36 kWh | 613.18 kWh |
| Total | 21,240 m³ | 1,867.2 m³ | — | — | 2,380.32 kWh | 2,074.48 kWh |
The actual electricity-savings point estimate is 2,380.32 kWh/year; the conservative-bound value is (5,520-500)×(0.100-0.005)+(10,080-880)×(0.112-0.005)+(5,640-487.2)×(0.124-0.005)=2,074.4832 kWh/year. The annual electricity-cost-savings point estimate is 2,380.32×0.80=1,904.256 yuan, and its lower bound is 2,074.4832×0.80=1,659.58656 yuan.
The 5-year equal-annual-cash-flow present-value factor is 4.32947667. Point-estimate net savings are 1,904.256×4.32947667-4,000=4,244.43 yuan; the lower bound is 1,659.58656×4.32947667-4,000=3,185.14 yuan. Point-estimate payback is 4,000/1,904.256=2.10 years. With equal annual saving lower bounds, upper-bound payback is 4,000/1,659.58656=2.41 years. NPV_save,L=3,185.14>0 and PB_U=2.41≤3.0 years, so the economic criterion passes.
09.4 Pressure, Functional Safety, and Overall Decision
For the pressure calculation, assume a critical-actuator minimum operating gauge pressure of 0.60 MPa. The peak-flow and lowest-inlet-pressure actions are the same, with 30 waveforms. Use the least favorable input values: P0=0.70 MPa and U_0=0.0084 MPa; baseline minimum P3=0.61 MPa and U_3=0.00732 MPa; post-retrofit minimum P3=0.65 MPa and U_3=0.0078 MPa:
R_Δp,total,U,base = 1-(0.61-0.00732)/(0.70+0.0084) = 14.9238%


R_Δp,total,U,after = 1-(0.65-0.0078)/(0.70+0.0084) = 9.3450%


p_3,min,L,after = 0.65-0.0078 = 0.6422 MPa
The baseline total pressure-loss upper bound exceeds 10%, so pressure fails. After the retrofit it is no greater than 10%, and the minimum-pressure lower bound exceeds 0.60 MPa, so pressure passes. This example includes no new or reconstructed header; the additional 2% header criterion does not apply.
The functional-safety matrix covers load retention after supply loss, emergency stopping, braking, grip confirmation, prevention of unintended release, and residual-energy management. Each test requires its load, initial state, command, holding duration, and binary acceptance criteria. For this calculation, assume all six test states pass and the safety-bypass count is 0. Combined with the preceding inputs, data, leakage, pressure, energy efficiency, economics, and functional safety all pass, giving an overall calculated pass. Actual release requires a corresponding test record for every item.
10Retrofit Priorities and Retesting
Perform the retrofit in the following fixed sequence. First, after removing the workpiece and suspended load and completing mechanical locking and lockout/tagout, isolate abandoned branches, idle equipment, and drains with nonzero air consumption. Second, repair leaks at fittings, hoses, valves, and seals. Third, based on segmented pressure-drop results, clean or replace filters, quick-connects, hoses, valve manifolds, and silencers; address regulators using manufacturer curves or synchronized measurements. Fourth, reduce the local pressure setting in 0.02 MPa increments. At every setting, perform all pressure-waveform and functional-safety tests in Chapter 06. The released setting is the lowest tested setting satisfying R_Δp,total,U≤10%, p_3,min,L≥p_required,min,g, and 100% functional-safety acceptance. Fifth, establish a PLC whitelist window for every blow-off and vacuum-generator command; record the window start signal, end signal, and duration in the controlled recipe. The condition fails if a command equals 1 outside its window in any cycle. Sixth, complete all functional-safety tests. Seventh, repeat the 7-day energy-efficiency measurement. Increasing compressor pressure or adding a compressor is not among the first six steps.
Retest using the frozen product-mix weights and unchanged cycle definition. Under Section 05.1, record each state–pressure-bin–valve-position combination again for 30 minutes. Pressure tests include every waveform of the two action types defined in Chapter 06. Safety tests cover supply-loss retention, emergency stopping, braking, grip confirmation, prevention of unintended release, residual-energy management, and all other functions required by the project risk assessment. Failure of any item prevents production in the energy-saving mode.
After release, calculate I_air,norm monthly from the latest complete month and retest leakage quarterly under Section 05.1. Repeat all six Chapter 11 criteria after any change to hoses, valve manifolds, regulators, vacuum generators, pressure settings, or control logic. If the lower bound of monthly normalized air-use intensity exceeds the release value by more than 10%, or quarterly R_leak,U>10%, locate the leak within 5 working days and initiate all six retests. If p_3,min,L falls below the design minimum or a safety function fails, immediately withdraw the energy-saving mode. Before resuming production, obtain the root-cause record, completed maintenance order, passing results for all six criteria, and equipment/safety-owner signatures. Missing records prevent restoration. Retain original data, formula revisions, and decision tables for at least 5 years, covering the complete LCC period and supporting continuous energy-performance improvement [12].
11FMEA, Risk Control, and Overall Release Criteria
| Failure Mode | Consequences | Detection and Control | Failure Trigger |
|---|---|---|---|
| Gauge Pressure Used in Place of Absolute Pressure in a Gas Equation | Systematic bias in air-use measurement | Record p_g, p_abs, and p_atm in separate fields | Unknown pressure reference |
| Mixing m³ or Nm³ with m³(ANR) | Non-comparable flow data | Convert all results to the ISO 8778 reference atmosphere | Missing reference temperature, pressure, or humidity |
| Production air use not isolated during the leakage test | Overstated leakage | Lock and tag out all production outlets | Any actuator moves during the test |
| Pressure-Loss Test Uses Average Pressure Only | Transient low pressure is missed | The same 1 kHz DAQ records four channels and bounds all waveforms on a sample-by-sample basis | Missing waveform, excessive pressure-loss upper bound, or insufficient pressure lower bound |
| Average Specific Power Used as Proof of Actual Savings | Overstated savings | Same-load marginal power–flow model or normalized whole-station measurement | Neither actual-saving evidence method is valid |
| Pressure Reduction Impairs Gripping or Braking | Load drift or unintended release | Perform every functional test and loss-of-pressure test specified by the controlled risk assessment | Any functional or safety test fails |
| Safety Exhaust Blocked During Leak Repair | Residual energy cannot be released | Check each point against the pneumatic schematic | Residual pressure cannot be released after isolation |
| Electricity Savings and Leakage Savings Counted Twice | Overstated savings | Calculate benefits once from the difference in total air use | The same air volume appears in both benefit entries |
| Estimated Stoppage Loss Reported as Confirmed Savings | Overstated LCC result | Use only amounts supported by financial records | An unsupported amount enters the model |
Overall release requires separate decisions on all six conditions. A project pass may be issued only when every condition passes:
- Data: Coverage, instruments, synchronization, bandwidth, repeatability, 7-day reconciliation, and the uncertainty budget satisfy Chapter 02.
- Leakage:
R_leak,U≤10%. - Pressure:
R_Δp,total,U≤10%andp_3,min,L≥p_required,min,g; new or reconstructed headers must also satisfyR_Δp,main,U≤2%. - Energy efficiency:
η_air,L≥5%and annual air-saving lower boundΔV_L>0. - Economics:
NPV_save,L>0andPB_U≤3.0 years. - Functional safety: 100% of the functional and safety tests in the controlled risk assessment pass, with zero safety bypasses. Missing risk assessment, binary acceptance criteria, or test records cause failure.
If any condition fails, the overall project fails. After corrective action, all six assessments must be repeated in full; partial retesting is not a substitute.
12Conclusions
Assessing compressed-air economics requires consistent reference conditions, integrated equipment-branch flow, state–pressure–valve-position leakage measurements, four-channel dynamic pressure, cycle counts, a matched-load marginal power–flow model and financial records. Inlet pressure, nameplate power or an isolated screenshot is insufficient to support a conclusion on its own. This method's project criteria are an upper leakage-rate bound of 10%, an upper total pressure-drop-ratio bound of 10%, a lower air-use-improvement bound of 5%, a positive lower net-present-value bound and an upper payback bound of 3 years, together with all other release requirements.
This method supports efficiency baselines, retrofit reviews, procurement comparisons of life-cycle cost and operational maintenance retesting. Formal project measurement records, risk assessments, design documents and test reports must jointly meet all six thresholds in Chapter 11 before a conclusion of “passes this assessment method” may be issued. Failure of any condition produces an overall “fail.”
The standard status verification base date is 2026-08-15: ISO 11011:2013, ISO 4414:2010, ISO 8778:2003, ISO 6358-1:2013, ISO 6358-2:2019, ISO 6358-3:2014 and ISO 50001:2018 are all in ISO Published status; ISO 1217:2009 is still a published version and in the revision stage; GB/T 7932-2017 is marked as current on the National Standard Information Public Service Platform. Chapters 05 and 12 are included in the ISO 6358 and ISO 50001 amendments published as of that date. When a project is started after the verification base date, the standard list must be re-compared on the project establishment date; if the comparison is not completed, the data items will not pass.
References
- ISO 11011:2013. Compressed air — Energy efficiency — Assessment. https://www.iso.org/standard/46580.html
- ISO 4414:2010. Pneumatic fluid power — General rules and safety requirements for systems and their components. https://www.iso.org/standard/44790.html
- GB/T 7932-2017 "General rules and safety requirements for pneumatic systems and their components". https://openstd.samr.gov.cn/bzgk/std/newGbInfo?hcno=8F5EDDC1CD00C550340316DBCEC789DD
- ISO 1217:2009. Displacement compressors — Acceptance tests; Amendment 1:2016. https://www.iso.org/standard/44769.html
- ISO 6358-1:2013, Amendment 1:2020 and Amendment 2:2026. Pneumatic fluid power — Determination of flow-rate characteristics of components using compressible fluids — Part 1: General rules and test methods for steady-state flow. https://www.iso.org/standard/56612.html
- ISO 6358-2:2019, Amendment 1:2026. Pneumatic fluid power — Determination of flow-rate characteristics of components using compressible fluids — Part 2: Alternative test methods. https://www.iso.org/standard/71270.html
- ISO 6358-3:2014. Pneumatic fluid power — Determination of flow-rate characteristics of components using compressible fluids — Part 3: Method for calculating steady-state flow-rate characteristics of systems. https://www.iso.org/standard/56616.html
- ISO 8778:2003. Pneumatic fluid power — Standard reference atmosphere. https://www.iso.org/standard/26559.html
- U.S. Department of Energy. Improving Compressed Air System Performance: A Sourcebook for Industry, Third Edition. https://www.energy.gov/sites/default/files/2016/03/f30/Improving%20Compressed%20Air%20Sourcebook%20version%203.pdf
- U.S. Department of Energy. Determine the Cost of Compressed Air for Your Plant, Compressed Air Tip Sheet #1. https://www.energy.gov/sites/default/files/2014/05/f16/compressed_air1.pdf
- U.S. Department of Energy / National Renewable Energy Laboratory. Uniform Methods Project, Chapter 22: Compressed Air Evaluation Protocol. https://www.energy.gov/sites/prod/files/2015/01/f19/UMPChapter22-compressed-air-evaluation.pdf
- ISO 50001:2018, Amendment 1:2024. Energy management systems — Requirements with guidance for use. https://www.iso.org/standard/69426.html